if (!require("pacman")) install.packages("pacman")
pacman::p_load(here, data.table, purrrlyr, reshape2,
               tidyverse,  flextable, SmartEDA, DataExplorer, DT,
               inspectdf, lubridate, janitor, forcats,
               fastDummies, units, tsibble, feasts, fable,
               tmap, tmaptools, mapdeck, leaflet, leafgl,
               rgeoda, osmdata,
               exactextractr, hereR, ggmap,
               kableExtra, knitr,
               colourvalues, viridis,
               readxl, ggfortify, gganimate,
grateful)STA5092Z EDA Lecture 5-6
Checking your data - Checklist
- Formulate your question
- Check your data
- Automate your project workflow
We will go through these using the Boston, Ames, World Happiness Datasets. Before moving on, we will look at the code chunk options:
echo: Show (TRUE) or hide (FALSE) the source code in output,eval: Execute (TRUE) or skip (FALSE) the code,include: Include both code and output in the rendered document (FALSE hides both),warning: Show (TRUE) or suppress (FALSE) warnings,message: Show (TRUE) or suppress (FALSE) messages,results: “markup” (default), “asis”, “hide”, “hold”. Controls how results are displayed,cache: Cache results for faster re-rendering,error: Show errors in output (TRUE) or stop rendering (FALSE).
Libraries
pacman::p_load() loads packages and installs missing ones. This is convenient for now, but in production/reproducible work you might want a fixed renv environment instead. See: renv
Ames Dataset
This problem presents a data set describing the sale of individual residential property in Ames, Iowa from 2006 to 2010. The data set contains 1460 observations and a large number of explanatory variables (nominal, ordinal, discrete, and continuous) involved in assessing home values. With 79 explanatory variables describing (almost) every aspect of residential homes in Ames, Iowa, this Kaggle competition challenges you to predict the final price of each home. The full dataset as provided on the Kaggle website has been provided on Vula in the file ames.csv or in the following link:
1) Load the data + quick missingness summary (variable-level)
ames <- read.csv(here::here("Datasets", "Ames", "ames.csv"))
library(naniar)
Warning: package 'naniar' was built under R version 4.4.3
Attaching package: 'naniar'The following object is masked from 'package:tsibble':
pedestrianames |>
miss_var_summary()# A tibble: 81 × 3
variable n_miss pct_miss
<chr> <int> <num>
1 PoolQC 1453 99.5
2 MiscFeature 1406 96.3
3 Alley 1369 93.8
4 Fence 1179 80.8
5 FireplaceQu 690 47.3
6 LotFrontage 259 17.7
7 GarageType 81 5.55
8 GarageYrBlt 81 5.55
9 GarageFinish 81 5.55
10 GarageQual 81 5.55
# ℹ 71 more rowsHere we should look for variables with very high percentage missingness which may need special handling (drop, impute, or treat missing as meaningful). Identify patterns like “structural missingness” (e.g., PoolArea missing because most houses have no pool).
2) Visualize missingness patterns (row-level + structure)
vis_miss(ames)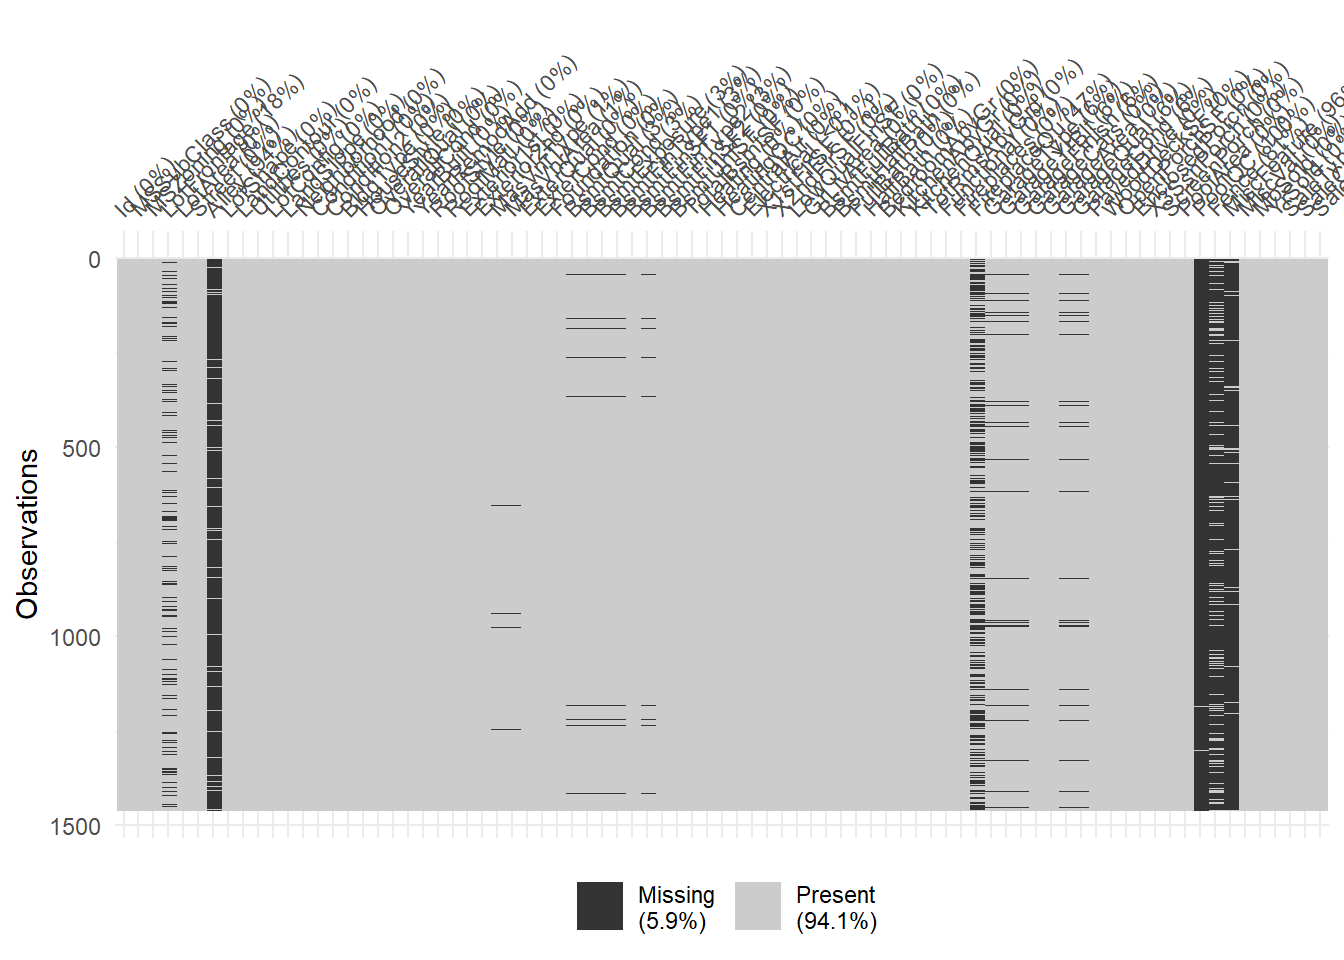
gg_miss_upset(ames)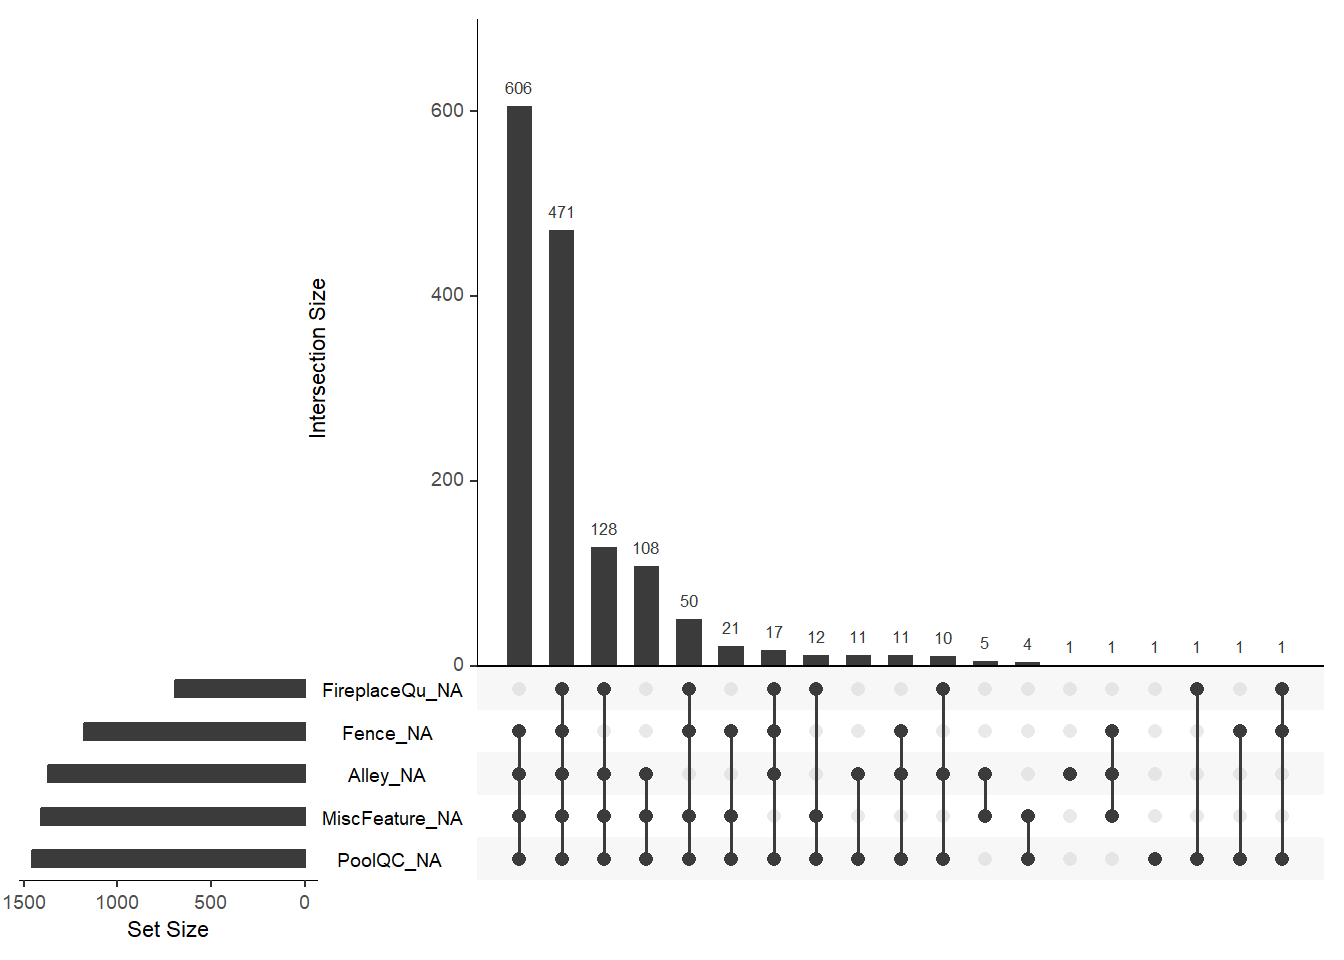
gg_miss_upset(ames, nsets=2) #nsets comparing the top missing two sets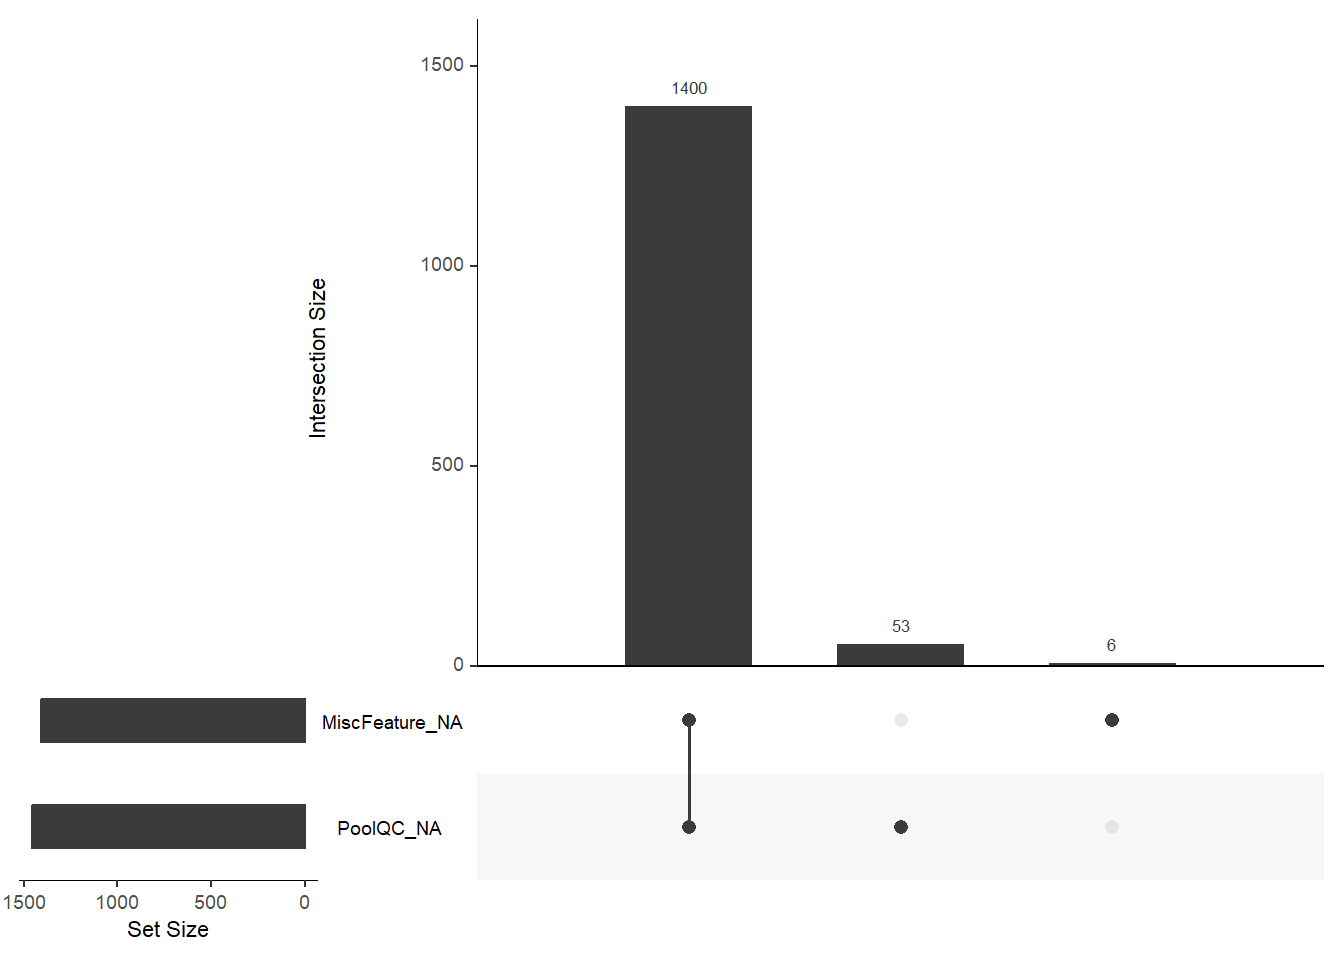
gg_miss_upset(ames, nintersects=3) #nsets, nintersects are some useful options.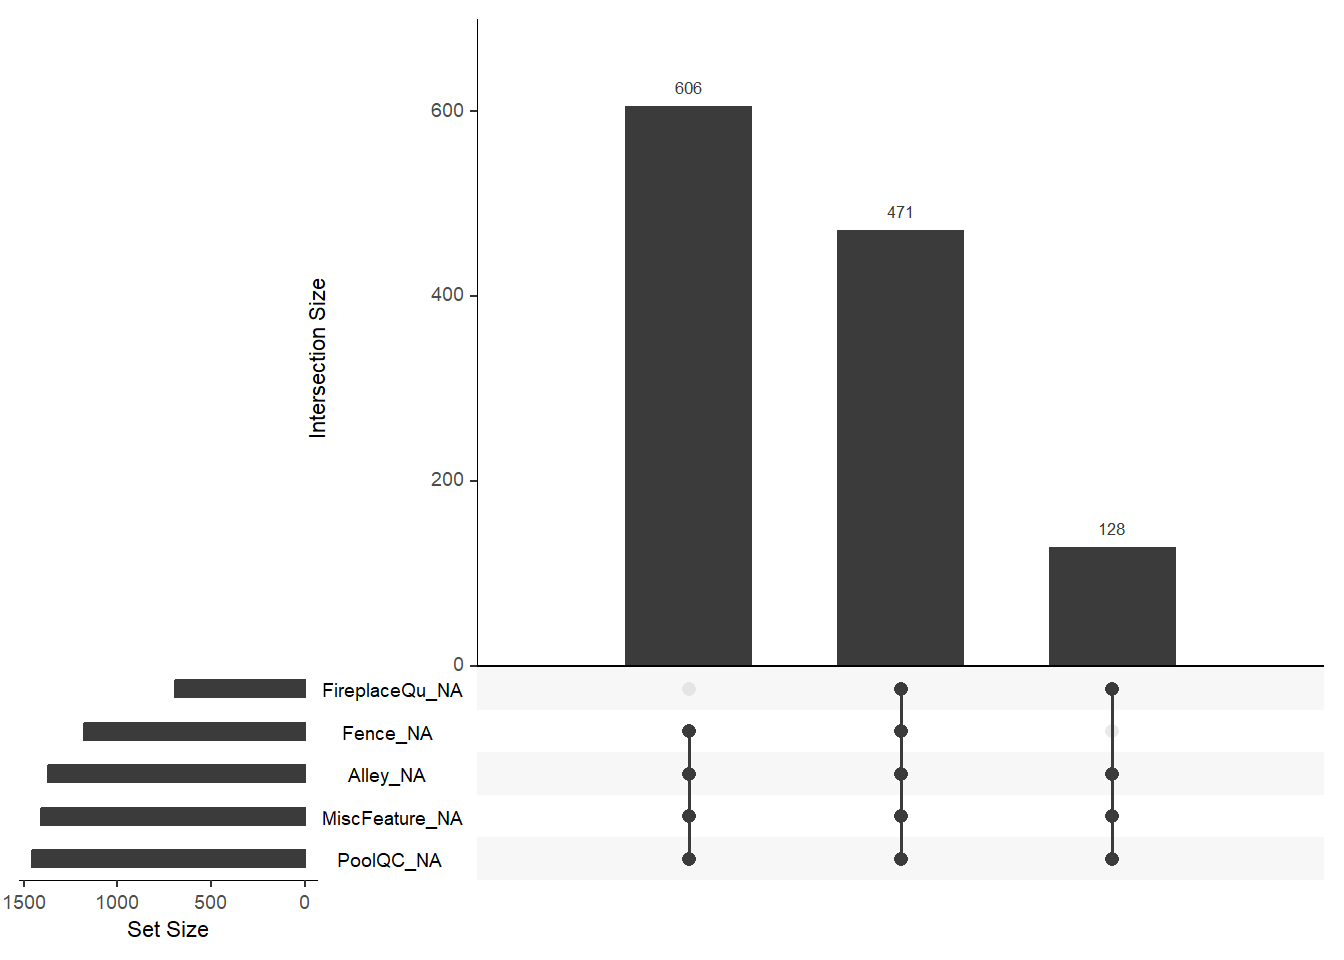
If a few variables dominate missingness, you can focus cleaning there. If certain variables always go missing together, it might indicate a data collection rule.
3) SmartEDA: automated overview tables
Are the variable types correct? Are there “coded” missing values (like 0 or 999) that aren’t NA?
library(SmartEDA)
summarytable = ExpData(data = ames, type = 2)
summarytable
Index Variable_Name Variable_Type Sample_n Missing_Count Per_of_Missing
1 1 Id integer 1460 0 0.000
2 2 MSSubClass integer 1460 0 0.000
3 3 MSZoning character 1460 0 0.000
4 4 LotFrontage integer 1201 259 0.177
5 5 LotArea integer 1460 0 0.000
6 6 Street character 1460 0 0.000
7 7 Alley character 91 1369 0.938
8 8 LotShape character 1460 0 0.000
9 9 LandContour character 1460 0 0.000
10 10 Utilities character 1460 0 0.000
11 11 LotConfig character 1460 0 0.000
12 12 LandSlope character 1460 0 0.000
13 13 Neighborhood character 1460 0 0.000
14 14 Condition1 character 1460 0 0.000
15 15 Condition2 character 1460 0 0.000
16 16 BldgType character 1460 0 0.000
17 17 HouseStyle character 1460 0 0.000
18 18 OverallQual integer 1460 0 0.000
19 19 OverallCond integer 1460 0 0.000
20 20 YearBuilt integer 1460 0 0.000
21 21 YearRemodAdd integer 1460 0 0.000
22 22 RoofStyle character 1460 0 0.000
23 23 RoofMatl character 1460 0 0.000
24 24 Exterior1st character 1460 0 0.000
25 25 Exterior2nd character 1460 0 0.000
26 26 MasVnrType character 1452 8 0.005
27 27 MasVnrArea integer 1452 8 0.005
28 28 ExterQual character 1460 0 0.000
29 29 ExterCond character 1460 0 0.000
30 30 Foundation character 1460 0 0.000
31 31 BsmtQual character 1423 37 0.025
32 32 BsmtCond character 1423 37 0.025
33 33 BsmtExposure character 1422 38 0.026
34 34 BsmtFinType1 character 1423 37 0.025
35 35 BsmtFinSF1 integer 1460 0 0.000
36 36 BsmtFinType2 character 1422 38 0.026
37 37 BsmtFinSF2 integer 1460 0 0.000
38 38 BsmtUnfSF integer 1460 0 0.000
39 39 TotalBsmtSF integer 1460 0 0.000
40 40 Heating character 1460 0 0.000
41 41 HeatingQC character 1460 0 0.000
42 42 CentralAir character 1460 0 0.000
43 43 Electrical character 1459 1 0.001
44 44 X1stFlrSF integer 1460 0 0.000
45 45 X2ndFlrSF integer 1460 0 0.000
46 46 LowQualFinSF integer 1460 0 0.000
47 47 GrLivArea integer 1460 0 0.000
48 48 BsmtFullBath integer 1460 0 0.000
49 49 BsmtHalfBath integer 1460 0 0.000
50 50 FullBath integer 1460 0 0.000
51 51 HalfBath integer 1460 0 0.000
52 52 BedroomAbvGr integer 1460 0 0.000
53 53 KitchenAbvGr integer 1460 0 0.000
54 54 KitchenQual character 1460 0 0.000
55 55 TotRmsAbvGrd integer 1460 0 0.000
56 56 Functional character 1460 0 0.000
57 57 Fireplaces integer 1460 0 0.000
58 58 FireplaceQu character 770 690 0.473
59 59 GarageType character 1379 81 0.055
60 60 GarageYrBlt integer 1379 81 0.055
61 61 GarageFinish character 1379 81 0.055
62 62 GarageCars integer 1460 0 0.000
63 63 GarageArea integer 1460 0 0.000
64 64 GarageQual character 1379 81 0.055
65 65 GarageCond character 1379 81 0.055
66 66 PavedDrive character 1460 0 0.000
67 67 WoodDeckSF integer 1460 0 0.000
68 68 OpenPorchSF integer 1460 0 0.000
69 69 EnclosedPorch integer 1460 0 0.000
70 70 X3SsnPorch integer 1460 0 0.000
71 71 ScreenPorch integer 1460 0 0.000
72 72 PoolArea integer 1460 0 0.000
73 73 PoolQC character 7 1453 0.995
74 74 Fence character 281 1179 0.808
75 75 MiscFeature character 54 1406 0.963
76 76 MiscVal integer 1460 0 0.000
77 77 MoSold integer 1460 0 0.000
78 78 YrSold integer 1460 0 0.000
79 79 SaleType character 1460 0 0.000
80 80 SaleCondition character 1460 0 0.000
81 81 SalePrice integer 1460 0 0.000
No_of_distinct_values
1 1460
2 15
3 5
4 110
5 1073
6 2
7 3
8 4
9 4
10 2
11 5
12 3
13 25
14 9
15 8
16 5
17 8
18 10
19 9
20 112
21 61
22 6
23 8
24 15
25 16
26 5
27 327
28 4
29 5
30 6
31 5
32 5
33 5
34 7
35 637
36 7
37 144
38 780
39 721
40 6
41 5
42 2
43 6
44 753
45 417
46 24
47 861
48 4
49 3
50 4
51 3
52 8
53 4
54 4
55 12
56 7
57 4
58 6
59 7
60 97
61 4
62 5
63 441
64 6
65 6
66 3
67 274
68 202
69 120
70 20
71 76
72 8
73 4
74 5
75 5
76 21
77 12
78 5
79 9
80 6
81 6634) Exporting summary tables to LaTeX (for reports)
This is especially important to make results “publication-ready”. Helps with controlling formatting rather than pasting screenshots.
library(knitr)
library(kableExtra)
library(magrittr)
Attaching package: 'magrittr'The following object is masked from 'package:ggmap':
insetThe following object is masked from 'package:purrr':
set_namesThe following object is masked from 'package:tidyr':
extractsummarytable |>
kable(format = 'latex', booktabs = TRUE) |>
add_header_above(header = c("Text" = 2, "Values" = 2))Or using flextable() package to obtain the summary for numerical variables:
library(flextable)
ExpNumStat(ames,by="A",gp=NULL,round=2,Nlim=50) |>
  flextable() |>
  autofit() # Summary Table
Vname | Group | TN | nNeg | nZero | nPos | NegInf | PosInf | NA_Value | Per_of_Missing | sum | min | max | mean | median | SD | CV | IQR | Skewness | Kurtosis |
|---|---|---|---|---|---|---|---|---|---|---|---|---|---|---|---|---|---|---|---|
BsmtFinSF1 | All | 1,460 | 0 | 467 | 993 | 0 | 0 | 0 | 0.00 | 647,714 | 0 | 5,644 | 443.64 | 383.5 | 456.10 | 1.03 | 712.25 | 1.68 | 11.08 |
BsmtFinSF2 | All | 1,460 | 0 | 1,293 | 167 | 0 | 0 | 0 | 0.00 | 67,962 | 0 | 1,474 | 46.55 | 0.0 | 161.32 | 3.47 | 0.00 | 4.25 | 20.04 |
BsmtUnfSF | All | 1,460 | 0 | 118 | 1,342 | 0 | 0 | 0 | 0.00 | 828,171 | 0 | 2,336 | 567.24 | 477.5 | 441.87 | 0.78 | 585.00 | 0.92 | 0.47 |
EnclosedPorch | All | 1,460 | 0 | 1,252 | 208 | 0 | 0 | 0 | 0.00 | 32,053 | 0 | 552 | 21.95 | 0.0 | 61.12 | 2.78 | 0.00 | 3.09 | 10.39 |
GarageArea | All | 1,460 | 0 | 81 | 1,379 | 0 | 0 | 0 | 0.00 | 690,551 | 0 | 1,418 | 472.98 | 480.0 | 213.80 | 0.45 | 241.50 | 0.18 | 0.91 |
GarageYrBlt | All | 1,460 | 0 | 0 | 1,379 | 0 | 0 | 81 | 5.55 | 2,728,360 | 1,900 | 2,010 | 1,978.51 | 1,980.0 | 24.69 | 0.01 | 41.00 | -0.65 | -0.42 |
GrLivArea | All | 1,460 | 0 | 0 | 1,460 | 0 | 0 | 0 | 0.00 | 2,212,577 | 334 | 5,642 | 1,515.46 | 1,464.0 | 525.48 | 0.35 | 647.25 | 1.37 | 4.87 |
Id | All | 1,460 | 0 | 0 | 1,460 | 0 | 0 | 0 | 0.00 | 1,066,530 | 1 | 1,460 | 730.50 | 730.5 | 421.61 | 0.58 | 729.50 | 0.00 | -1.20 |
LotArea | All | 1,460 | 0 | 0 | 1,460 | 0 | 0 | 0 | 0.00 | 15,354,569 | 1,300 | 215,245 | 10,516.83 | 9,478.5 | 9,981.26 | 0.95 | 4,048.00 | 12.20 | 202.54 |
LotFrontage | All | 1,460 | 0 | 0 | 1,201 | 0 | 0 | 259 | 17.74 | 84,130 | 21 | 313 | 70.05 | 69.0 | 24.28 | 0.35 | 21.00 | 2.16 | 17.38 |
MasVnrArea | All | 1,460 | 0 | 861 | 591 | 0 | 0 | 8 | 0.55 | 150,551 | 0 | 1,600 | 103.69 | 0.0 | 181.07 | 1.75 | 166.00 | 2.67 | 10.04 |
OpenPorchSF | All | 1,460 | 0 | 656 | 804 | 0 | 0 | 0 | 0.00 | 68,124 | 0 | 547 | 46.66 | 25.0 | 66.26 | 1.42 | 68.00 | 2.36 | 8.46 |
SalePrice | All | 1,460 | 0 | 0 | 1,460 | 0 | 0 | 0 | 0.00 | 264,144,946 | 34,900 | 755,000 | 180,921.20 | 163,000.0 | 79,442.50 | 0.44 | 84,025.00 | 1.88 | 6.51 |
ScreenPorch | All | 1,460 | 0 | 1,344 | 116 | 0 | 0 | 0 | 0.00 | 21,989 | 0 | 480 | 15.06 | 0.0 | 55.76 | 3.70 | 0.00 | 4.12 | 18.37 |
TotalBsmtSF | All | 1,460 | 0 | 37 | 1,423 | 0 | 0 | 0 | 0.00 | 1,543,847 | 0 | 6,110 | 1,057.43 | 991.5 | 438.71 | 0.41 | 502.50 | 1.52 | 13.20 |
WoodDeckSF | All | 1,460 | 0 | 761 | 699 | 0 | 0 | 0 | 0.00 | 137,597 | 0 | 857 | 94.24 | 0.0 | 125.34 | 1.33 | 168.00 | 1.54 | 2.98 |
X1stFlrSF | All | 1,460 | 0 | 0 | 1,460 | 0 | 0 | 0 | 0.00 | 1,697,435 | 334 | 4,692 | 1,162.63 | 1,087.0 | 386.59 | 0.33 | 509.25 | 1.38 | 5.72 |
X2ndFlrSF | All | 1,460 | 0 | 829 | 631 | 0 | 0 | 0 | 0.00 | 506,609 | 0 | 2,065 | 346.99 | 0.0 | 436.53 | 1.26 | 728.00 | 0.81 | -0.56 |
YearBuilt | All | 1,460 | 0 | 0 | 1,460 | 0 | 0 | 0 | 0.00 | 2,878,051 | 1,872 | 2,010 | 1,971.27 | 1,973.0 | 30.20 | 0.02 | 46.00 | -0.61 | -0.44 |
YearRemodAdd | All | 1,460 | 0 | 0 | 1,460 | 0 | 0 | 0 | 0.00 | 2,897,904 | 1,950 | 2,010 | 1,984.87 | 1,994.0 | 20.65 | 0.01 | 37.00 | -0.50 | -1.27 |
5) Numeric summaries with SmartEDA + display with flextable
See what summary information there is available for you. PPeek at column names of the summary output so you can select/format them.
ExpNumStat(ames,by="A",gp=NULL,round=2,Nlim=50) |>
  names()
[1] "Vname" "Group" "TN" "nNeg"
[5] "nZero" "nPos" "NegInf" "PosInf"
[9] "NA_Value" "Per_of_Missing" "sum" "min"
[13] "max" "mean" "median" "SD"
[17] "CV" "IQR" "Skewness" "Kurtosis" Select only a few informative columns (Vname, min, max, CV) and customise header row for readability. You’re modelling good communication: don’t overwhelm people with 20 columns.
ExpNumStat(ames,by="A",gp=NULL,round=2,Nlim=50) |>
  select(c("Vname","min", "max", "CV")) |>
  flextable() |>
  delete_part(part = "header") |>
  add_header_row(
    values = c("Variable", "Minimum", "Maximum", "Coefficient of Variation")) |>
  bold(part = "header") |>
  align(align = "center", part = "header")|>
  theme_booktabs()
Variable | Minimum | Maximum | Coefficient of Variation |
|---|---|---|---|
BsmtFinSF1 | 0 | 5,644 | 1.03 |
BsmtFinSF2 | 0 | 1,474 | 3.47 |
BsmtUnfSF | 0 | 2,336 | 0.78 |
EnclosedPorch | 0 | 552 | 2.78 |
GarageArea | 0 | 1,418 | 0.45 |
GarageYrBlt | 1,900 | 2,010 | 0.01 |
GrLivArea | 334 | 5,642 | 0.35 |
Id | 1 | 1,460 | 0.58 |
LotArea | 1,300 | 215,245 | 0.95 |
LotFrontage | 21 | 313 | 0.35 |
MasVnrArea | 0 | 1,600 | 1.75 |
OpenPorchSF | 0 | 547 | 1.42 |
SalePrice | 34,900 | 755,000 | 0.44 |
ScreenPorch | 0 | 480 | 3.70 |
TotalBsmtSF | 0 | 6,110 | 0.41 |
WoodDeckSF | 0 | 857 | 1.33 |
X1stFlrSF | 334 | 4,692 | 0.33 |
X2ndFlrSF | 0 | 2,065 | 1.26 |
YearBuilt | 1,872 | 2,010 | 0.02 |
YearRemodAdd | 1,950 | 2,010 | 0.01 |
#autofit()6) Summary tables per group (group-aware EDA)
You can have your summary tables per group. Some EDA questions are conditional: e.g., “Do houses with different heating types have different distributions for some numeric variable?”
You need to decide to use Group based on which variable? Are group differences meaningful, or just noise? Do missing values differ by group (potential bias)?
ExpNumStat(ames,by="A",gp=NULL,round=2,Nlim=50) |>
  select(c("Vname","Group", "min", "max", "CV")) |>
  flextable() |>
  delete_part(part = "header") |>
  width(j = c("min","max","Vname"), width = 1) |>
  width(j = "Group", width = 1) |>
  width(j = "CV", width = 1.4) |>
#  set_table_properties(layout = "fixed")|>
  add_header_row(
    values = c("Variable","Heating Group", "Minimum", "Maximum", "Coefficient of Variation")) |>
  bold(part = "header") |>
  align(align = "center", part = "header")|>
  theme_booktabs()
Variable | Heating Group | Minimum | Maximum | Coefficient of Variation |
|---|---|---|---|---|
BsmtFinSF1 | All | 0 | 5,644 | 1.03 |
BsmtFinSF2 | All | 0 | 1,474 | 3.47 |
BsmtUnfSF | All | 0 | 2,336 | 0.78 |
EnclosedPorch | All | 0 | 552 | 2.78 |
GarageArea | All | 0 | 1,418 | 0.45 |
GarageYrBlt | All | 1,900 | 2,010 | 0.01 |
GrLivArea | All | 334 | 5,642 | 0.35 |
Id | All | 1 | 1,460 | 0.58 |
LotArea | All | 1,300 | 215,245 | 0.95 |
LotFrontage | All | 21 | 313 | 0.35 |
MasVnrArea | All | 0 | 1,600 | 1.75 |
OpenPorchSF | All | 0 | 547 | 1.42 |
SalePrice | All | 34,900 | 755,000 | 0.44 |
ScreenPorch | All | 0 | 480 | 3.70 |
TotalBsmtSF | All | 0 | 6,110 | 0.41 |
WoodDeckSF | All | 0 | 857 | 1.33 |
X1stFlrSF | All | 334 | 4,692 | 0.33 |
X2ndFlrSF | All | 0 | 2,065 | 1.26 |
YearBuilt | All | 1,872 | 2,010 | 0.02 |
YearRemodAdd | All | 1,950 | 2,010 | 0.01 |
# autofit()7) Missingness in scatterplots: is missingness related to outcome?
If LotFrontage is missing more often for low- or high-priced houses, the missingness may not be random (important for modelling decisions).
ames |>
  ggplot(aes(x=LotFrontage, y=SalePrice)) +
  geom_miss_point()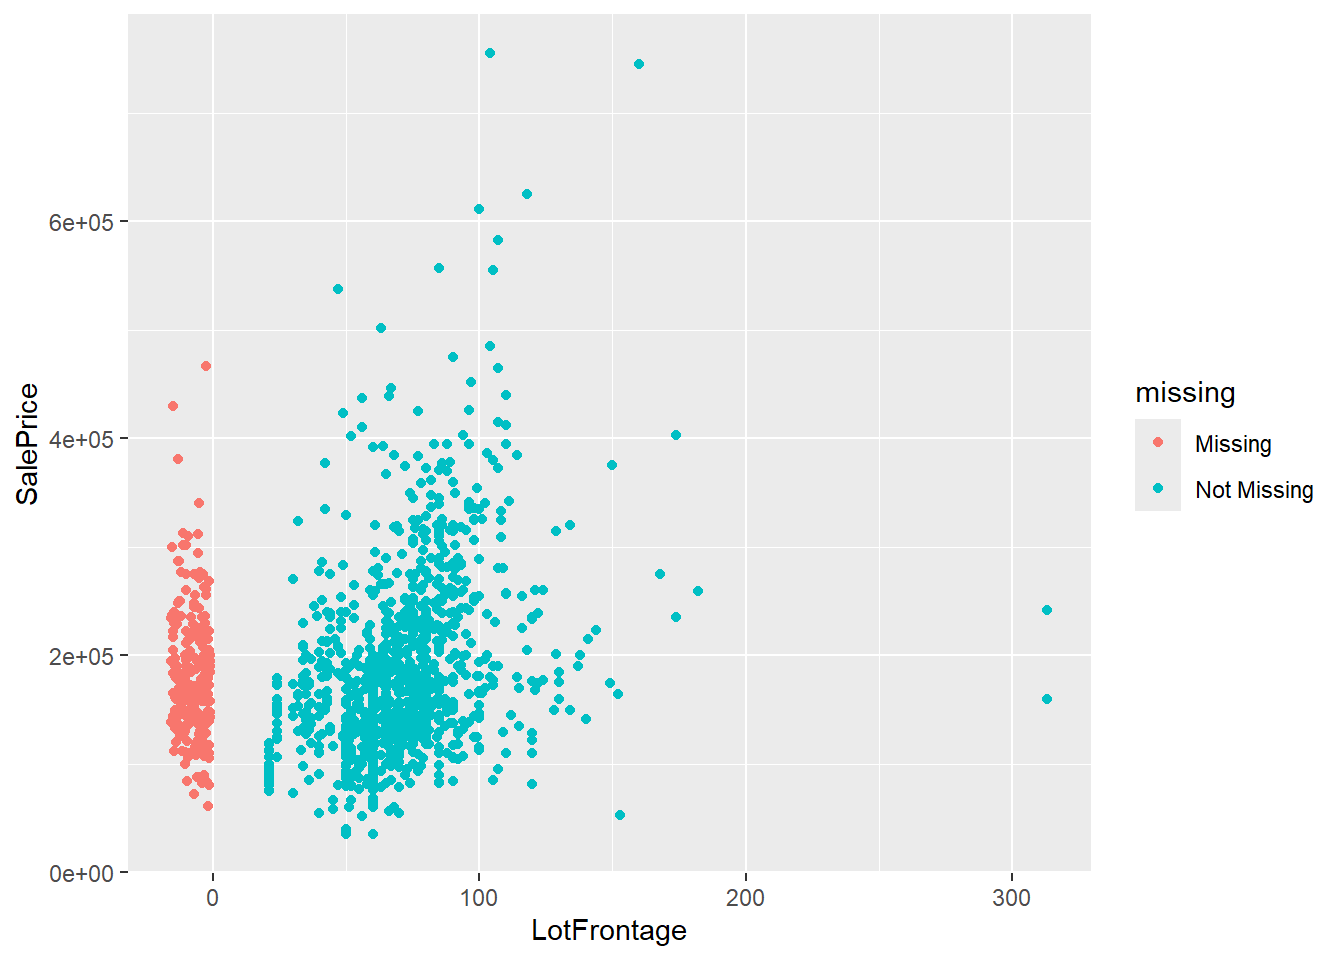
8) Example: zeros / rare values (PoolArea)
Understand the distribution of PoolArea. Often PoolArea is 0 for most houses (no pool) and positive for a few.
ames |>
  count(PoolArea)
PoolArea n
1 0 1453
2 480 1
3 512 1
4 519 1
5 555 1
6 576 1
7 648 1
8 738 1ames |>
summarise(meanpool = mean(PoolArea, na.rm = TRUE)) meanpool
1 2.758904ames |>
ggplot(aes(x=PoolArea))+
geom_bar(stat="count", fill="steelblue")+
theme_minimal()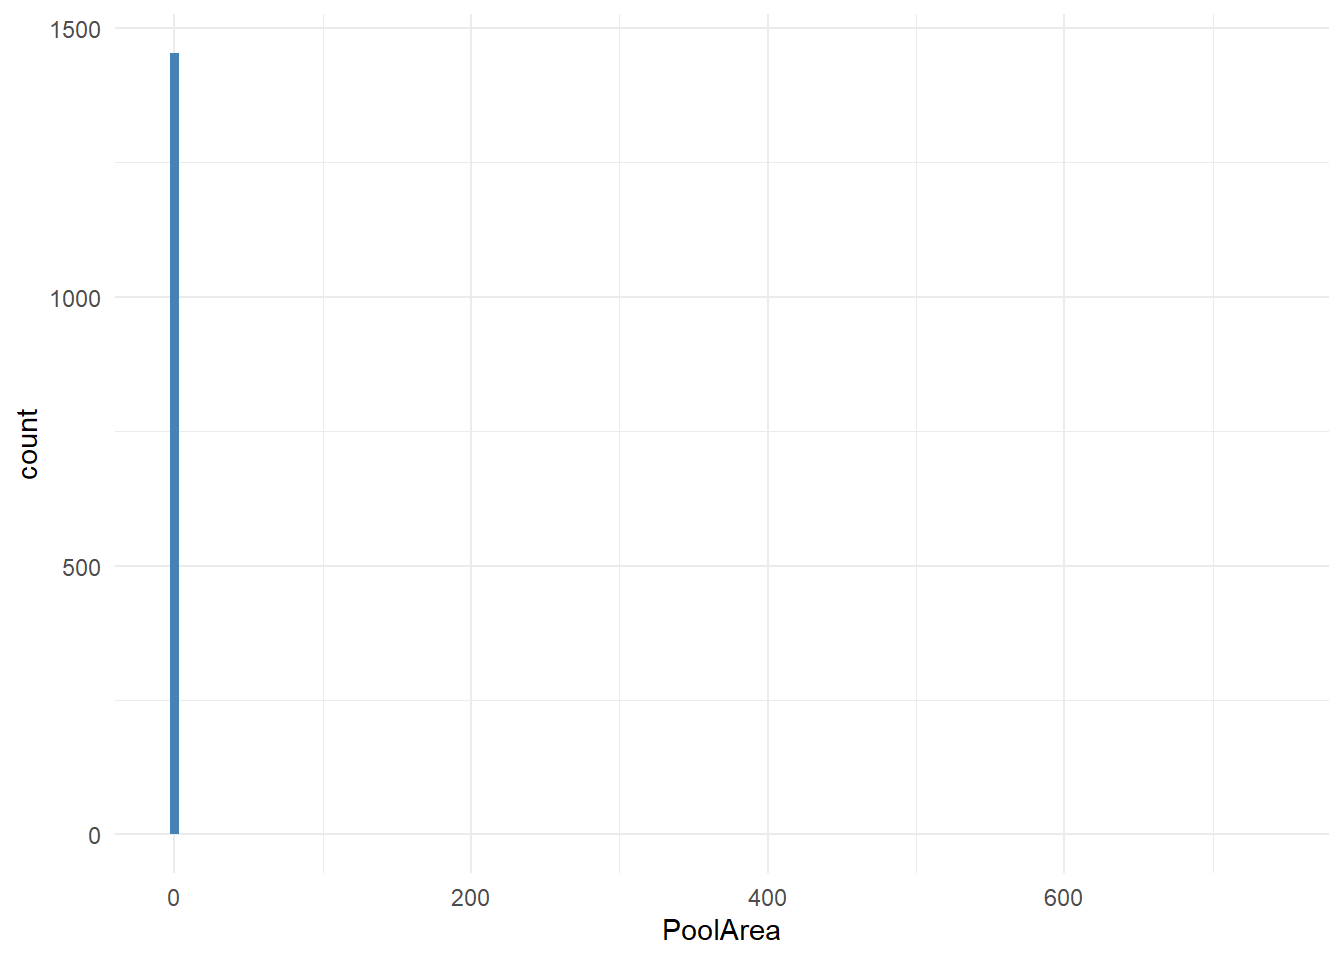
ames |>
ggplot(aes(x=factor(PoolArea)))+
  geom_bar(stat="count", fill="steelblue")+
  theme_minimal()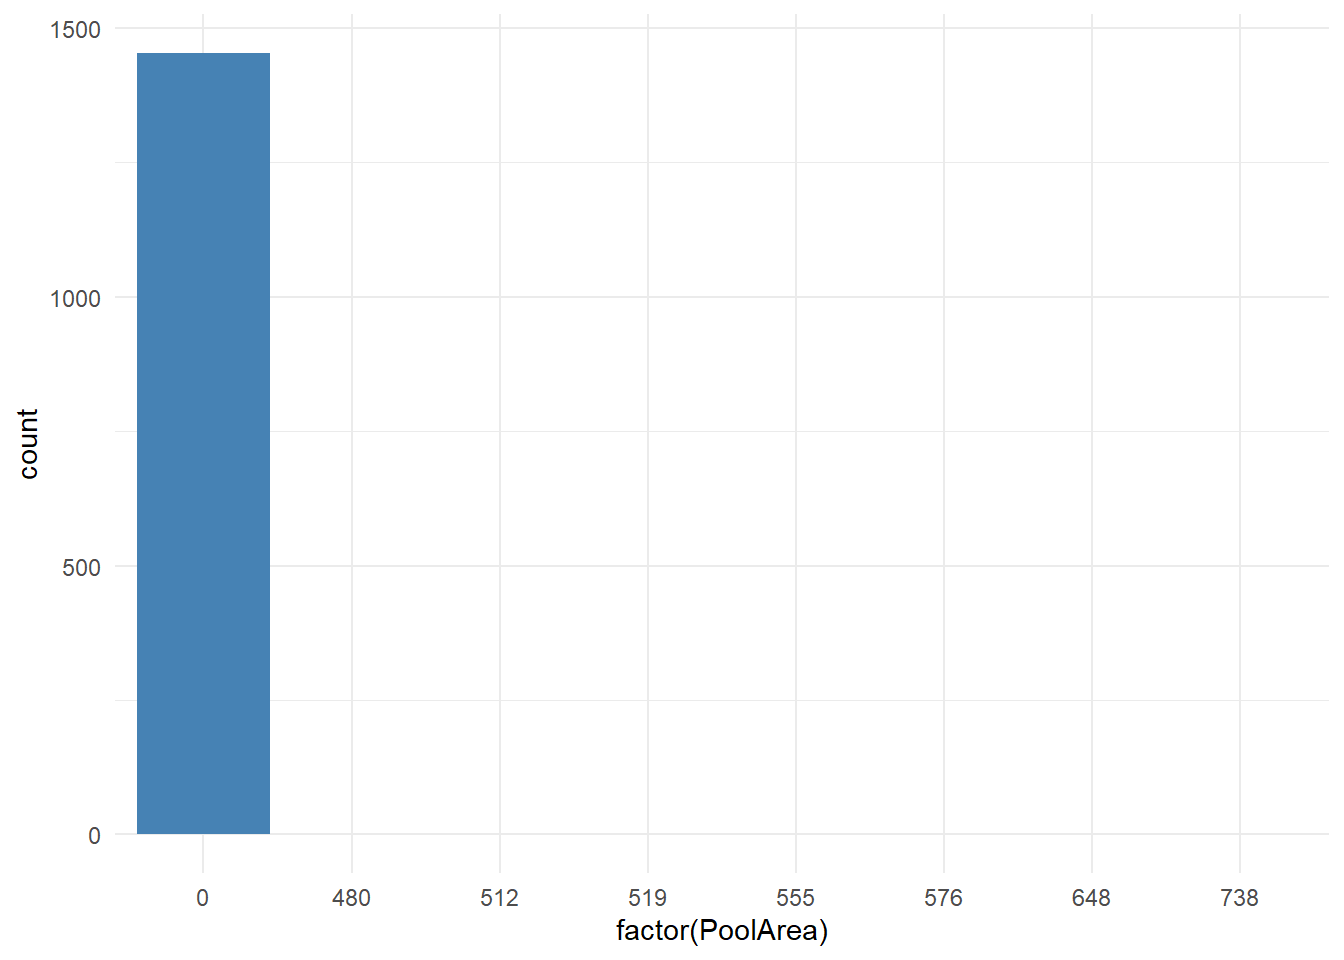
9) Faceting to compare relationships across subgroups (PoolArea)
Does the LotFrontage–SalePrice relationship differ by PoolArea category? Faceting is a quick “small multiples” strategy to explore subgroup structure.
ames |>
  ggplot(aes(x=LotFrontage, y=SalePrice)) +
  geom_miss_point()+
  facet_wrap(~PoolArea)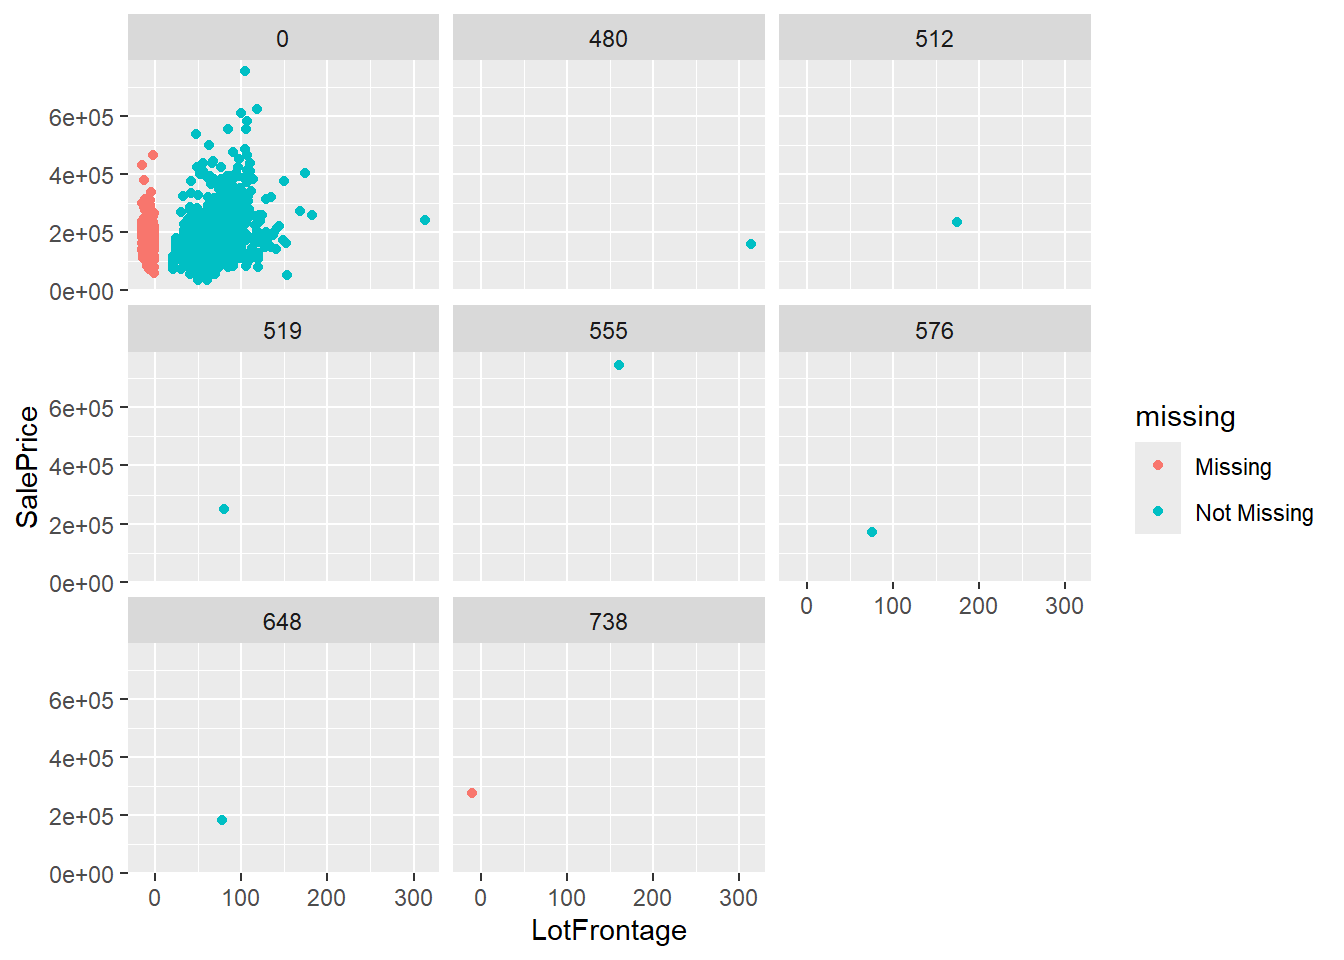
10) Missingness by group + missingness by factor
If missingness differs across groups, analyses can become biased.
ames |>
  group_by(Street) |>
  miss_var_summary()
# A tibble: 160 × 4
# Groups: Street [2]
Street variable n_miss pct_miss
<chr> <chr> <int> <num>
1 Pave PoolQC 1447 99.5
2 Pave MiscFeature 1403 96.5
3 Pave Alley 1363 93.7
4 Pave Fence 1173 80.7
5 Pave FireplaceQu 686 47.2
6 Pave LotFrontage 258 17.7
7 Pave GarageType 80 5.50
8 Pave GarageYrBlt 80 5.50
9 Pave GarageFinish 80 5.50
10 Pave GarageQual 80 5.50
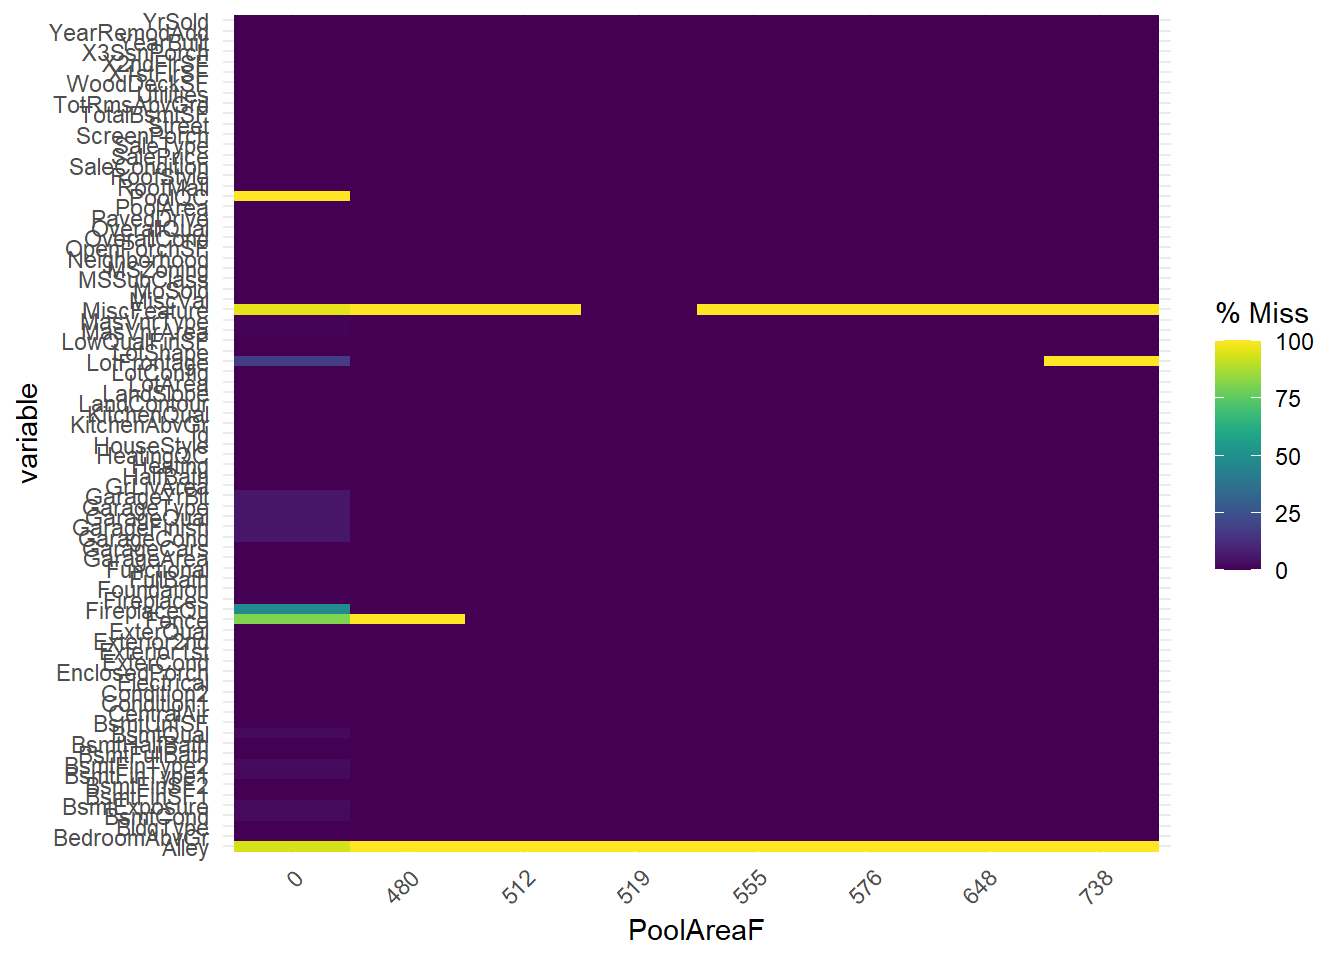
# ℹ 150 more rowsames <- ames |>
mutate(PoolAreaF = as.factor(PoolArea))
gg_miss_fct(x=ames, fct = PoolAreaF)